
POPULATION.
KONA, KAUAI, AND NIIHAU.
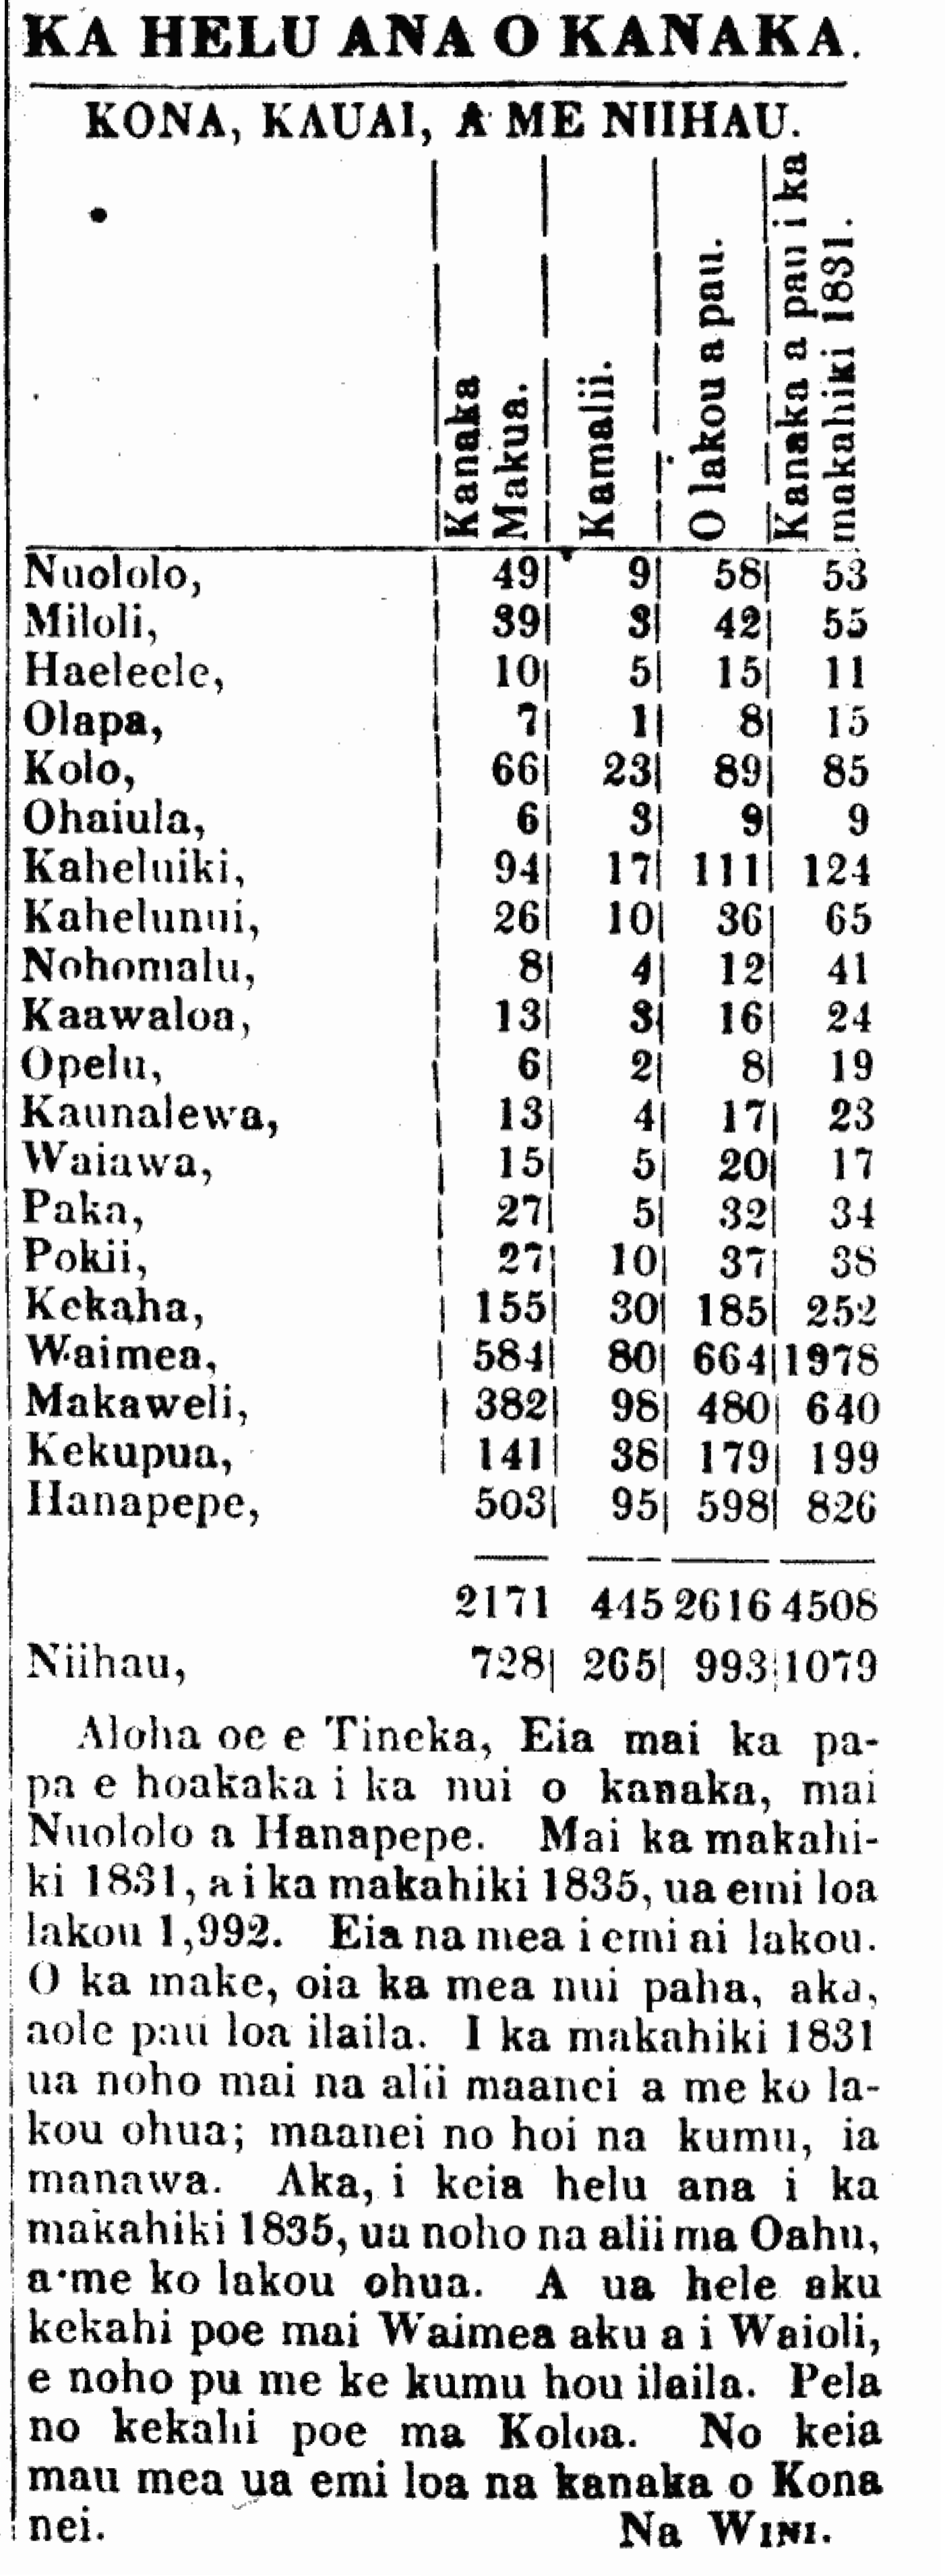
| Adults | Children | All together | Entire population in 1831 | |
| Nuololo | 49 | 9 | 58 | 53 |
| Miloli | 39 | 3 | 42 | 55 |
| Haeleele | 10 | 5 | 15 | 11 |
| Olapa | 7 | 1 | 8 | 15 |
| Kolo | 66 | 23 | 89 | 85 |
| Ohaiula | 6 | 3 | 9 | 9 |
| Kaheluiki | 94 | 17 | 111 | 124 |
| Kahelunui | 26 | 10 | 36 | 65 |
| Nohomalu | 8 | 4 | 12 | 41 |
| Kaawaloa | 13 | 3 | 16 | 24 |
| Opelu | 6 | 2 | 8 | 19 |
| Kaunalewa | 13 | 4 | 17 | 23 |
| Waiawa | 15 | 5 | 20 | 17 |
| Paka | 27 | 5 | 32 | 34 |
| Pokii | 27 | 10 | 37 | 38 |
| Kekaha | 155 | 30 | 185 | 252 |
| Waimea | 584 | 80 | 664 | 1978 |
| Makaweli | 382 | 98 | 480 | 640 |
| Kekupua | 141 | 38 | 179 | 199 |
| Hanapepe | 503 | 95 | 598 | 826 |
| 2171 | 445 | 2616 | 4508 | |
| Niihau | 728 | 265 | 993 | 1079 |
Aloha to you, O Tinker [Tineka]. This is a chart showing the number of people from Nualolo to Hanapepe. From 1831 to 1835, there was a great decrease of 1,992. This is the reasons for their decrease. Death is perhaps the biggest cause, but that is not all. In 1831, the alii were living here and their retinue; here as well were the teachers at that time. However, during this census in 1835, the alii were living on Oahu along with their ohua. And some people went from Waimea to Waioli to live with the new teacher there. So too some people from Koloa. For these reasons, the people here in Kona [Kauai] have sharply decreased. By Whitney [Wini].
(Kumu Hawaii, 12/23/1835, p. 204)
Ke Kumu Hawaii, Buke 1, Pepa 26, Aoao 204. Detemaba 23, 1835.

Pingback: Population decline, 1835. | nupepa